 Gamma Indicators
Understanding GEX Source Modes
Combined, ETF Only, and Index Only — learn when and why to use each mode for maximum edge.
1. Combined Mode (ETF + Index)
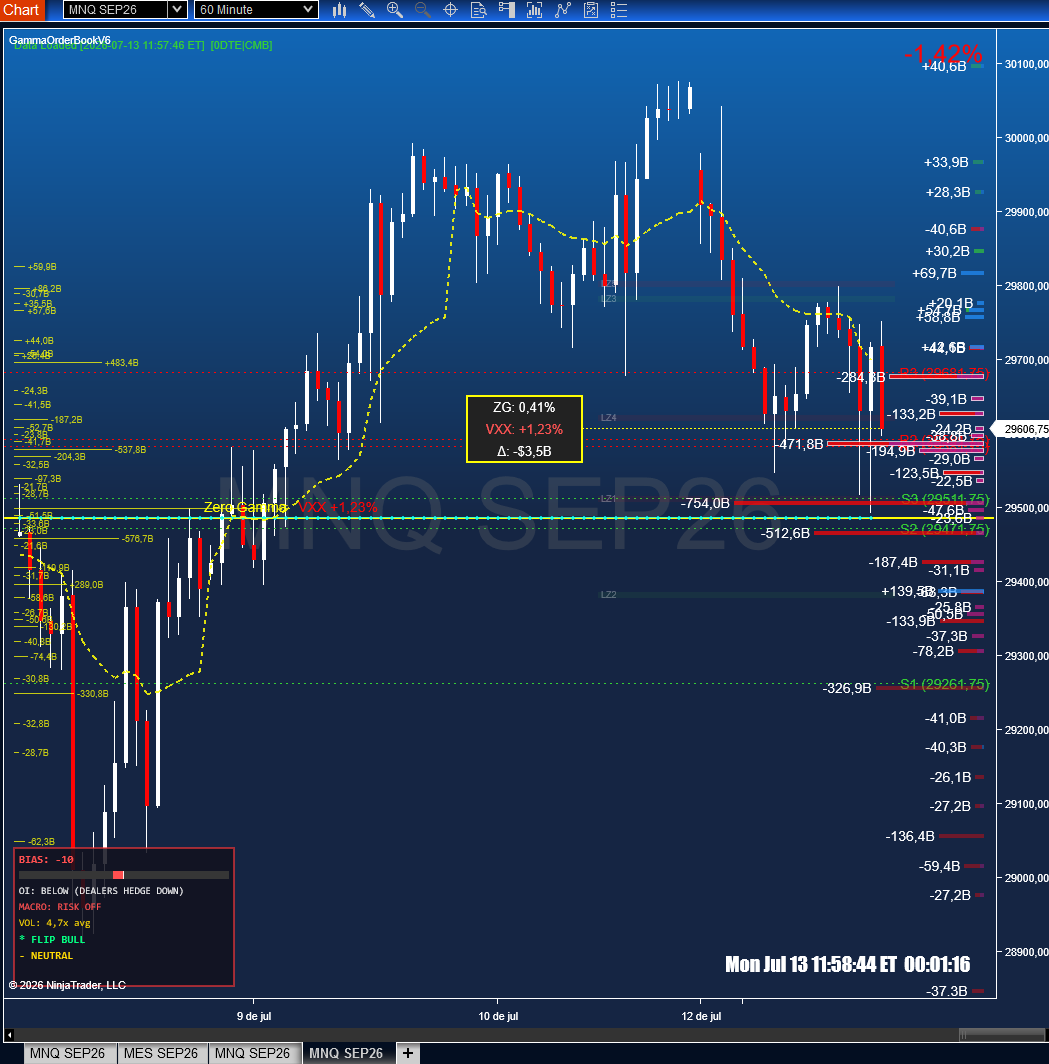
DEFAULT — Recommended for most tradersThis mode displays the total dealer gamma exposure by combining options data from both the ETF (QQQ) and the Index (NDX). This represents the full picture of how market makers are positioned and where they need to hedge.
💡 Why Combined?
Market makers hedge BOTH QQQ and NDX options simultaneously. The combined view shows the TRUE total exposure. In some cases, retail (QQQ) and institutional (NDX) gamma cancel each other out — this mode reveals those dynamics. It's the most accurate representation of where dealers will actually need to buy or sell.
2. ETF Only Mode (QQQ / SPY)
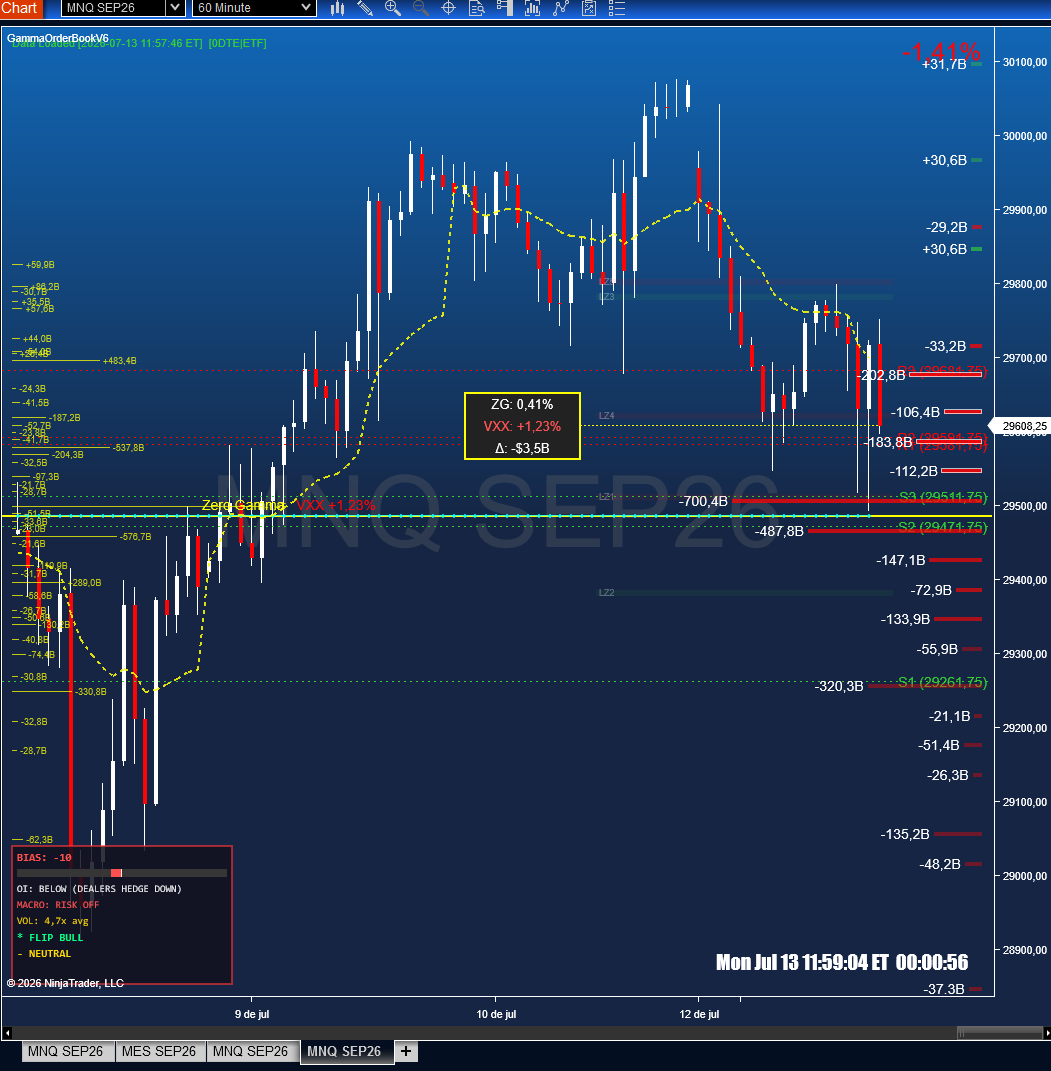
Retail flow — Most reactiveShows gamma exposure from ETF options only (QQQ for Nasdaq, SPY for S&P). ETF options are dominated by retail traders, smaller funds, and algorithmic strategies. This view is the most reactive to intraday changes.
💡 When to use ETF Only?
Use this mode when you want to see WHERE RETAIL IS POSITIONED. It's especially useful for day trading because retail 0DTE options (QQQ weeklies) drive most of the intraday gamma pinning. If you're scalping or looking for intraday magnets/walls, this mode shows the clearest picture.
3. Index Only Mode (NDX / SPX)
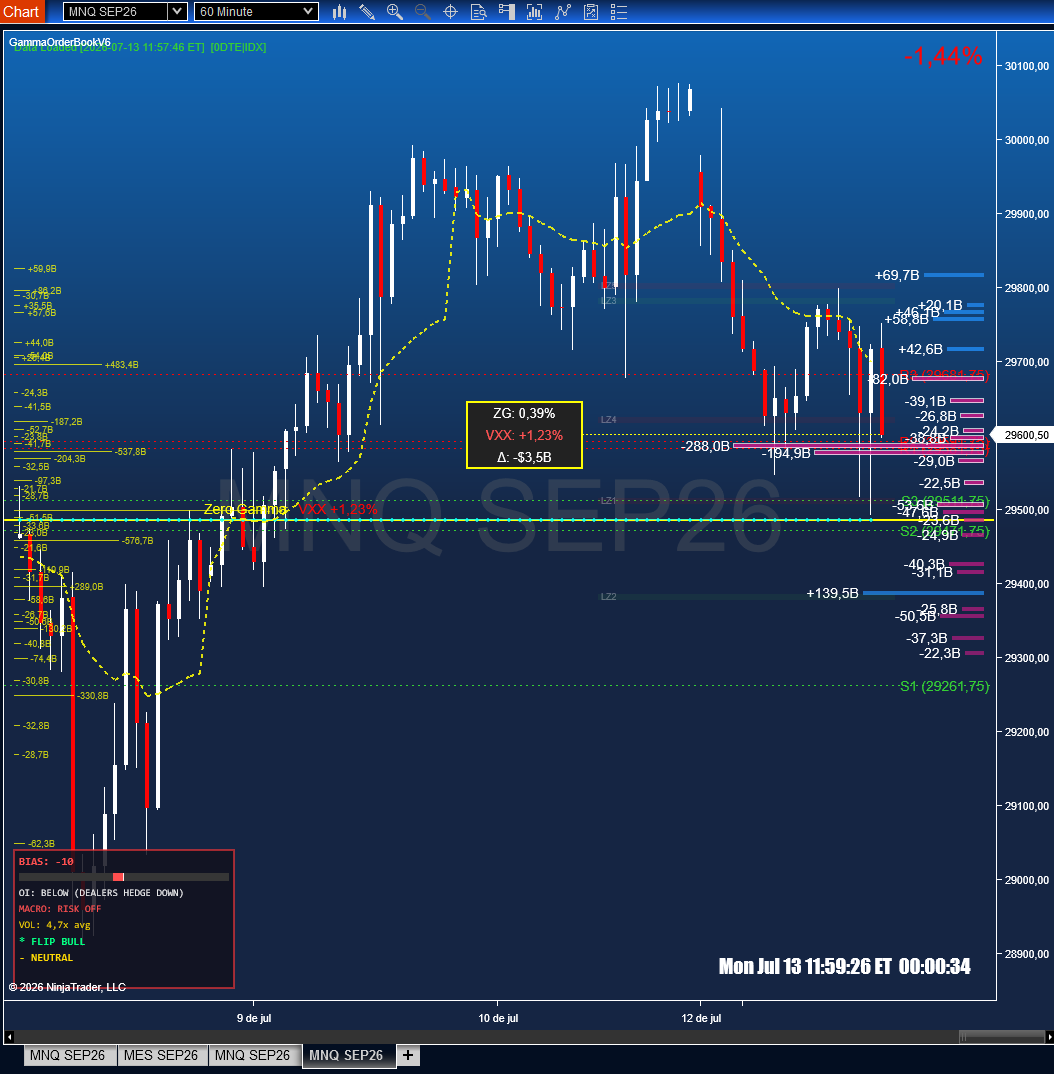
Institutional flow — Most stableShows gamma exposure from Index options only (NDX for Nasdaq, SPX for S&P). Index options are traded primarily by institutions, hedge funds, pension funds, and large market makers. These positions are typically larger, more strategic, and change less frequently.
💡 When to use Index Only?
Use this mode to understand the BIG MONEY positioning. Institutional gamma walls from NDX/SPX options often act as multi-day support/resistance that retail flow alone cannot break. These are the levels that define weekly ranges and major reversals. Best for swing trading and understanding structural market context.
Mode Comparison
| Feature | Combined | ETF Only | Index Only |
|---|---|---|---|
| Data Source | QQQ + NDX merged | QQQ only | NDX only |
| Participants | Everyone | Retail, small funds, algos | Institutions, hedge funds, pensions |
| Reactivity | Medium | High (changes fast intraday) | Low (changes slowly) |
| Best For | Overall market structure | Day trading, scalping | Swing trading, weekly ranges |
| Zero Gamma | Stable (anchored by institutions) | Reactive (moves with retail flow) | Very stable (institutional anchor) |
| Typical Use | Default — shows true dealer exposure | "Where is retail betting?" | "Where are the big walls?" |
Key Elements on the Chart
| Element | Description |
|---|---|
| ZG: 0.41% | Current price is 0.41% ABOVE Zero Gamma. Above = suppression regime (bullish). Below = amplification regime (bearish). |
| VXX: +1.23% | VXX is UP (shown in red) = rising volatility/fear. Dealers must hedge more aggressively. Green = falling VXX = calm / suppression. |
| Δ: -$3.5B | Delta Exposure (DEX). Dealers are NET SHORT $3.5 billion in delta. They need to BUY if price rises (supportive) or SELL if price drops (cascading). |
| Panorama V4 (yellow bars) | Structural GEX from ALL expirations. Shows where the major "walls" are across days/weeks. These levels define the broader range. |
| S1, S2, S3 / R1, R2, R3 | GEX-based Support and Resistance. Derived from the top Panorama V4 levels above/below current price. |
| LZ (Liquidity Zones) | Areas where future expirations have 3x more OI than 0DTE. These are "hidden" gamma walls not visible in the daily bars. |
| Bias Panel | Composite score (-100 to +100) combining regime, OI distribution, ZG slope, macro conditions, and volume. Includes Gamma Flip detection. |
Ready to Trade with GEX?
Get GammaOrderBook V6 and access all three GEX source modes on your NinjaTrader chart.